


Katy, our Junior Paid Social Manager, runs through the ins, outs, whys and wherefores of marketing attribution models.
Ever since I started working with Facebook ads, there has been the ongoing quibbling surrounding attribution and the discrepancies between Google data and Facebook’s ads data.
If you are putting marketing efforts into multiple channels (whether that is SEO, PPC, Paid Social etc.) you’ll want to know how they’re working in conjunction with each other.
This is where attribution modelling comes in.
Why Is This Important?
Often, especially when considering social advertising, it takes a customer multiple touchpoints with a brand before they convert. The number of touchpoints will vary from product to product depending on the consideration process. For example, an inexpensive and spontaneous clothing purchase compared to selecting the right car insurance will have quite different journeys.
How Does Conversion Attribution Differ from Platform to Platform?
Let’s start with the basics and focus on the differences between the two biggest players: Facebook and Google, and how they attribute conversions.
Facebook’s default attribution setting is based on a last touch model, and within a default window of 28-day post click, 1-day post view.
Google attributes conversions on a last click model, within a default window of 30-day post click.
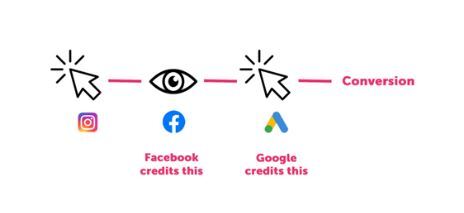
Take my *very simplified* example of a customer journey above. The user has never heard of this brand before, they see an ad on Instagram, and they click through. This user is currently at work, so doesn’t have time to make a purchase. The next day, the user sees a Facebook ad (through retargeting) for the same brand and is reminded again of the brand or product. Later, she does a Google search and purchases through a search ad.
Which advertising channel should receive credit for the conversion? Google will, by default, credit the search ad as it was the last click in the journey. Facebook will credit the Facebook ad, as it was the last touch in the journey. Neither Facebook nor Google in this instance are concerned with the other channel, and both will claim the conversion.
Whatever your opinion on where the credit should go, it’s important to recognise that there were multiple steps in the journey. It is almost impossible to tell whether the conversion would have happened without certain touchpoints, which is why attribution modelling is a very individual consideration – not all models will suit every business.
Credit Where Credit is Due
This is where marketing attribution modelling comes in. Alongside the default models that we discussed earlier, there are loads of other models out there. Here is a low-down on the most common ones – we can split them into two groups: single touch and multi-touch.
Single Touch
These models assign full credit to one single touchpoint in the conversion journey. While these are simpler to deal with, they completely disregard all other touchpoints – which seems slightly unfair.
Last click

We’ve already mentioned this as Google Analytics’ default model. It assigns all conversion credit to the last click in the purchase journey.
- Pros: it’s often the default model, and it’s simple and straightforward to use
- Cons: it disregards all other touchpoints in the journey and is quite a one-dimensional way of looking at things
First touch

This is another simple one – all credit is assigned to the touchpoint that was first in the journey prior to conversion.
- Pros: like the last click model, it’s simple to use and apply
- Cons: again, it disregards all other touchpoints in the journey
Last touch

Facebook’s default model – this model assigns all credit to the last touch, whether it was an impression or click.
- Pros: makes more sense to rely on this model if you’re only using one paid channel, eg. Facebook or Instagram ads
- Cons: disregards other touchpoints and also can be seen to be a ‘greedy’ way of claiming conversion credit!
Multi-touch
Multi-touch models work by assigning fractional credit of each conversion to multiple touchpoints in the journey. They’re slightly more complicated to apply but they often make more sense to look at if you’re spending lots of money on multiple channels.
Linear (or ‘even credit’)

This model assigns an even amount of credit to each touchpoint in the user journey.
- Pros: it’s probably the simplest way of looking at multi-touch attribution models, and can be a great place to start if you’re just starting out in comparing models for your business
- Cons: it depends on your marketing strategy and industry, but it’s up for discussion as to whether it’s really a fair way of attributing conversion credit eg. should the second point in the journey really receive the same amount of credit as the first or last?
Positional (or ‘U’ shaped)

This is where it starts getting slightly more complicated (although still relatively simple…). The positional, or ‘U’ shaped model, typically works on either a 40% or 30% model. In the 40% model, both the first and last points are credited with 40% credit each, and the remaining 20% is split between all other touchpoints. In the 30% model, 30% is given to the first and last touch points, and the remaining 40% is split between all other conversions.
- Pros: a slightly more complex way of looking at the way your different marketing channels work together. It’s argued that the first point and the last point (ie. the discovery and the final conversion push) are the most important elements of the conversion journey, and this model supports that notion
- Cons: although it does consider multiple touchpoints, the positional model is still quite rigid and restrictive
Time decay

The time decay model offers some level of credit to every channel in the conversion journey, with most being assigned to the points closer to the final conversion. The two most common time decay models are 7 days or 1 day – these refer to the ‘half-life’ used within the model formula; the 7-day model assigns 50% of credit to interactions that happened within 7 days of one another.
- Pros: one of the more advanced models that can be used, it considers each interaction in relation to each other and timeframes are also measured
- Cons: the first touchpoints in the conversion aren’t given much credit, which can often disregard crucial awareness activity; also because of its complex nature, it can be more time consuming to apply
Data-driven
Data-driven models aren’t often mentioned in the same space as the more generic models above – in fact, we could probably write a whole separate blog examining how data-driven attribution works. Google Analytics offers a data-driven model to those with a Google 360 Analytics account and Facebook offers its own data-driven model within its relatively new Facebook Attribution platform. These models allow you to create models based on your own existing data.
- Pros: DDA is the most sophisticated form of attribution modelling, allowing you to break away from a one-size-fits-all approach that the previous models offer
- Cons: There are certain requirements that you need to meet to be able to use a data-driven model – as mentioned above, to utilise Google’s data-driven solution, you must have a Google 360 Analytics account, which is pricey. You also need to have a lot of existing data (on both Facebook and Google). Another con is that these each platform’s models don’t totally consider the data from other platforms. Google Analytics historically does not track Facebook data properly (with no impression data) and Facebook’s data driven model only considers Facebook data
Attribution windows
Attribution windows are the time frame in which a conversion is tracked. We mentioned these earlier when talking about Google and Facebook’s default. Facebook’s default window is 28 day post-click and 1 day post-view. This means that if a user clicks on a Facebook ad and then converts within 28 days of that click, Facebook will count that conversion. The post-view window means that Facebook will claim the conversion if somebody views an ad and then converts up to a day later.
Google’s default window is 30 days post click, meaning if somebody clicks on an ad and then converts up to 30 days after the click, this conversion will be recorded.
Views or clicks?
It’s up for discussion as to whether the post-view window can fairly take credit for a conversion – we don’t necessarily know how much impact an ad had on a user just from an impression. Could it have had that much impact if the ad didn’t even encourage them to click on it?
This is where you could start to think about the different types of attribution reporting for different types of campaigns. You may not want to use the same attribution window to report on retargeting campaigns as you do with awareness campaigns. For example, a lot of social advertising will fall under the category of brand awareness – these ads may not even be optimised for clicks, they could instead be optimised for video views. When looking at retargeting / direct response campaigns, post-click only reporting may make sense to your business, whereas including view-through conversions may make sense to include when reporting on awareness campaigns.

Selecting the Right Attribution Model for Your Business
Selecting a model of attribution for your business isn’t necessarily a one-size fits all approach, which is why there are so many different models and approaches that exist. It can take time to work through the pros and cons of each method, so here are some considerations to start thinking about.
Do you already know the general length of your customer journey?
This will depend on the product or service that your company sells, as we mentioned at the beginning of the blog post. Real estate companies will naturally have much longer journeys than inexpensive ecommerce products. This is going to inform the attribution windows that will make the most sense for you to focus on.
Do you know the business value of your conversions?
This will be straightforward for aforementioned ecommerce businesses, but for businesses that focus on generating leads (e.g. B2B marketing) this could be a more complicated process. Assigning a value to all of the conversions that you’re tracking will allow you to more accurately assess return on ad spend if you decide to use a multi-touch attribution model, as conversions are fractionated and credit is shared between channels.
Set out goals or questions you’d like to answer before delving into the data
If your business runs a lot of high-spend activity across multiple channels and this is the first real in-depth dive you’ll be doing into attribution, there’s likely going to be a lot of data to get through. Without a goal in mind, this data can seem quite meaningless or overwhelming. An example goal could be “we want to understand how our awareness activity on social impacts the rest of the customer journey” or “what channel is driving most of our awareness?”. From there, you’ll be able to map out your data a lot quicker.
Choosing the right platforms
Free attribution platforms (that are completely accurate and give you everything you want) are almost impossible to find, but with that being said, I would recommend trying out Facebook’s Attribution tool, which is part of the Business Manager suite – you can plug in third party ad platform data such as Google Ads and import cost and click data into the platform. Google Analytics definitely has its place, but the lack of impression data available for social platforms is a big limitation in my eyes.
If you have any questions about understanding and optimising your customer journey, or about putting together a multi-channel paid media plan, get in touch with our talented team. Someone from Team Social or Team PPC would love to delve deep into your data and help you increase your ROI.